In the modern digital landscape, the average brand interacts with customers across a minimum of six to eight touchpoints before a conversion occurs. You might be running high-energy video ads on TikTok, visual storytelling campaigns on Instagram, professional outreach on LinkedIn, and niche community engagement on Reddit. While this multi-channel approach is vital for brand reach, it creates a massive logistical headache: data fragmentation.
When your performance metrics are trapped in “platform silos,” you aren’t seeing the whole truth. You are seeing a collection of disjointed chapters that don’t quite form a narrative. To scale effectively in 2026, businesses must transition from manual reporting to a Complete View of their marketing performance.
The Crisis of Data Fragmentation
Most marketing teams suffer from “Dashboard Fatigue.” Every morning, a specialist logs into Meta to check ROAS, jumps over to TikTok to check engagement rates, and then opens Google Analytics to see web traffic.
The problem? These platforms don’t talk to each other.
-
Meta will claim credit for a sale because the user clicked an ad three days ago.
-
Google Analytics might credit the same sale to “Organic Search” because the user eventually googled the brand name.
-
TikTok might show high engagement, but you can’t see how those viewers behave once they land on your site compared to Pinterest users.
Without a unified view, you are essentially flying a plane with five different altimeters, all giving different readings. This leads to “The Spreadsheet Trap”—spending 10 hours a week copying and pasting data into Excel instead of actually marketing.
Why You Need a “Complete View”
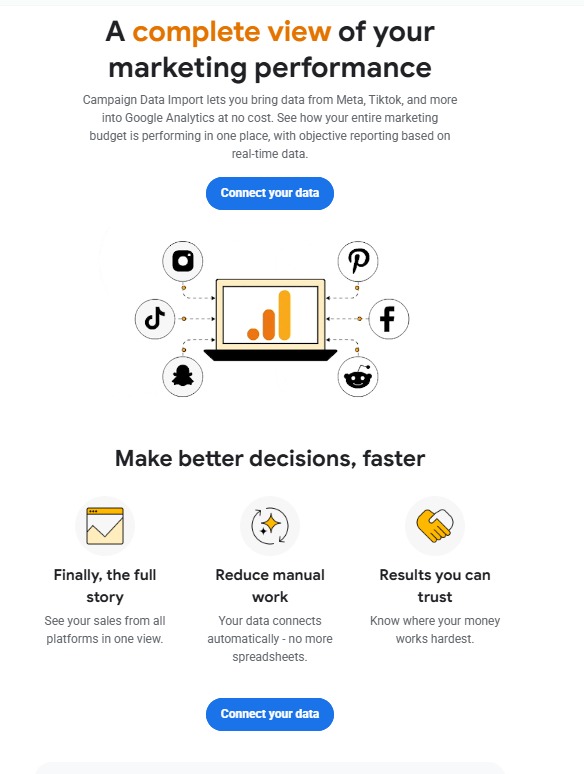
As shown in the Campaign Data Import framework, bringing data from Meta, TikTok, Snapchat, and others into a single source of truth (like Google Analytics) offers three transformative benefits:
1. Finally, the Full Story
Marketing is a journey, not a single event. A user might see a TikTok video, click a Pinterest pin later that day, and finally buy after seeing a Remarketing ad on Facebook. When you import all this data into one place, you can see the cross-channel attribution. You move away from “Last Click” models and start understanding the true value of your top-of-funnel awareness campaigns.
2. Drastic Reduction in Manual Work
Manual data entry is the silent killer of marketing ROI. It is slow, prone to human error, and keeps your most expensive talent doing entry-level tasks. Automation through data imports means your reports are ready before you even sit down with your coffee. No more broken VLOOKUPs or outdated spreadsheets.
3. Results You Can Trust
When data is centralized, it is objective. You can compare the Cost Per Acquisition (CPA) of a Snapchat campaign against a Reddit thread using the exact same metrics and timeframes. This level of transparency ensures that you know exactly where your money “works hardest.”
Bridging the Gap with Search Engine Optimization (SEO)
While paid ads provide the “fuel” for growth, SEO remains the engine. A unified data view often reveals a startling fact: your paid social ads are actually driving your organic search volume. This is known as the “halo effect.”
When people see your ads on TikTok, they don’t always click. Often, they go to Google and search for your brand. If your SEO strategy isn’t aligned with your paid social messaging, you lose that lead. This is why working with a comprehensive digital partner like WindowIT is critical. You need a team that understands how to optimize your website to capture the traffic generated by your cross-platform marketing efforts.
The Role of GEO-Targeted Content
In 2026, “General SEO” is no longer enough. To truly dominate, you need GEO-SEO. This means tailoring your content and data analysis to specific geographic locations. A unified dashboard allows you to see that while your TikTok ads are performing great nationally, they are specifically driving massive organic conversions in regions where you have optimized local landing pages.
How to Implement a Unified Data Strategy
Moving toward a complete view of your marketing performance requires a shift in both tools and mindset.
Step 1: Identify Your Core Platforms
List every platform where you spend money or time. This includes:
-
Social: Meta (FB/IG), TikTok, Pinterest, Snapchat, Reddit.
-
Search: Google Ads, Bing Ads.
-
Content: YouTube, Blog (SEO).
Step 2: Utilize Campaign Data Import
Google Analytics (GA4) allows for “Data Imports.” You can upload cost data from non-Google platforms. This allows GA4 to calculate Non-Google ROAS and CPA right alongside your organic traffic data.
Step 3: Standardize Your UTM Parameters
Data integration only works if your tracking is clean. Use a strict UTM naming convention across all platforms so that when the data hits your central dashboard, it is categorized correctly. For example:
-
utm_source=tiktok -
utm_medium=paid_video -
utm_campaign=summer_sale_2026
Step 4: Analyze and Pivot
Once the data is flowing, look for the “Waste.” Every marketing budget has it. You might find that your Snapchat ads have a high click-through rate but a 99% bounce rate on your website. This insight allows you to kill that campaign and move the budget to Meta, where the conversion rate is higher.
The WindowIT Advantage
Navigating the technical requirements of data API integrations, GA4 configurations, and advanced SEO can be overwhelming for business owners. WindowIT specializes in creating these “Complete Views.” By aligning technical SEO with high-performance marketing data, they ensure that every digital dollar you spend is tracked, analyzed, and optimized.
Whether it’s setting up automated data pipelines or ensuring your website ranks for the keywords that people search for most, having an expert partner allows you to focus on running your business while the data handles the “better decisions, faster.”
Future-Proofing Your Marketing
The future of marketing is Privacy-First Data. With the phasing out of third-party cookies, “First-Party Data” (the data you own) is becoming the most valuable asset in your company. By importing your campaign data into your own analytics environment, you are building a proprietary database of customer behavior that no algorithm change can take away.
Make the decision today to stop guessing. Connect your data, see the full story, and start investing in the channels that actually move the needle for your bottom line.
FAQ: Common Questions About Data Integration
Q: Does importing data into Google Analytics cost money? A: Most Campaign Data Import features are available at no cost, though some third-party “connector” tools may charge a monthly fee to automate the upload process.
Q: Can I see TikTok data in Google Analytics? A: Yes! By using Data Imports, you can see your TikTok spend, impressions, and clicks right next to your website conversion data.
Q: How does this help my SEO? A: By seeing which social media topics drive the most “Assisted Conversions,” you can direct your SEO team to write blog posts on those specific high-intent topics.